Our apartment in Cambridge Massachusetts is similar to many in the region—just under 1,000 ft2 of space in a three family home built in the early 20th century. It’s a wonderful building with charm and character, but literally no insulation. It’s been a cold and generally uncomfortable space during much of the winter. Fortunately for us, that changed this past January when we had cellulose insulation blown into the exterior walls through the Mass Save program. We had over $3,300 worth of insulation work done and paid just a fraction of the cost; if your state offers free or discounted energy audits and efficiency work, you should seriously consider it.
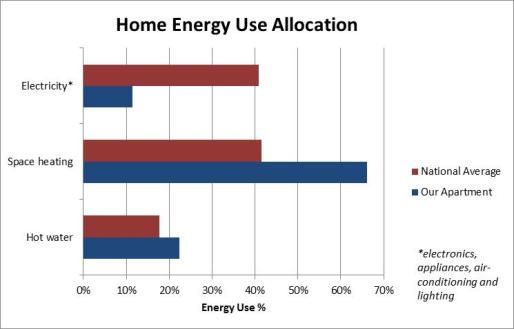
I’ve been tracking our energy consumption since we moved in just under 2 years ago, and calculating OPEN (operational energy) efficiency scores each month since our first year. Our average score has been a 63 (out of 100), which is above average but not great considering the steps we have taken to reduce our electricity use—killing vampire loads, using LED bulbs, shutting down our wireless router when not in use, etc. These steps certainly improved our score (and saved us money), but it’s just not possible to have an efficient home—even an apartment—in the northeast without insulation. Energy required for space heating dominates here; it accounts for approximately 68% of the energy used in our apartment, with 22% used for hot water and 12% for electricity (nationally these averages are 41.5%, 17.7% and 40.8% respectively).
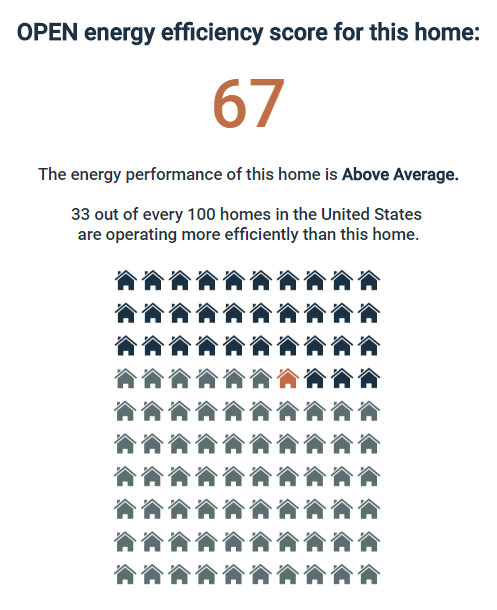
My wife and I agree that the apartment feels more comfortable since the insulation was blown in, but I’ve been looking forward to seeing the impact the insulation work would have on our OPEN score. I want to be able to quantify the improvement rather than relying solely on our (likely biased) qualitative assessment. After receiving our first utility bills since the work was done and calculating a score, this is what we found:

After just a single winter month, our OPEN score jumped from an average of 63 to a 67! As you can see from the graph, our score over the last year (dark blue line) has been fairly consistent, bouncing between a low of 61 and a high of 64 prior to the insulation. It will be interesting to see how the score progresses over the next few months, but it’s already clear that there is a quantifiable improvement in our home’s energy performance. It’s gratifying to see that the money and time spent on the insulation work is having a definitive impact.
Calculate OPEN scores for your home here: www.resynergysystems.com
Author’s note: The OPEN score and energy consumption graph in this post was updated on March 29th 2017 to correct for a data entry error. Text referring to incorrect scores has been updated as well.

One comment