MPG for homes? Not yet.

If I had penny for every time I heard someone use the “MPG for homes” analogy in the energy-rating world, I’d have gleaming copper gutters on my house. It’s a powerful comparison that I’ve used myself, since most people are familiar with and trust (Volkswagen aside) the EPA’s fuel ratings for automobiles. If you’re anything like me, then you rely on MPG ratings to make buying decisions, which is one of the reasons the Volkswagen manipulation scandal was so disturbing. Our trust was shaken.

If we want to create an MPG for homes, it needs to be trustworthy. This is not easily accomplished, as accurately assessing the energy efficiency of a home is surprisingly difficult. Traditionally, we have relied on asset (i.e. home structure) ratings like RESNET’s Home Energy Rating System (HERS) and the DOE’s Home Energy Score (HES). These scores use complex energy modelling software and detailed in-person assessments of homes to generate scores that reflect efficiency. As these systems rely on human input and models—neither of which are 100% accurate—they aren’t perfect, but they are the best we currently have, at least for assessing structural efficiency.

Unfortunately, the effort and costs associated with in-person assessments have prevented these traditional asset ratings from scaling rapidly. In response, a number of organizations have tried to develop inexpensive and scalable scores derived from public record data. The ability to assess homes at scale using this data was the goal of research initiated by Kate Goldstein and Michael Blasnik, but their intention was to identify homes that had a high probability of being good efficiency retrofit candidates. This idea is now being applied to the real estate market.

The highly respected Rocky Mountain Institute (RMI) recently released a report titled “An MPG for Homes” which explores the use of market forces to promote residential efficiency. I highly recommend reading it. The report highlights recent developments in the use of public record scores on some of the largest real estate portals in the United States. RealEstate.com (owned by The Zillow Group) and Redfin now showcase public record scores developed by Utility Score and Tendril respectively, and Utility Scores will soon be accessible on Zillow, making public record scores available for millions of homes. The hope is that sharing these scores will encourage homeowners to make purchasing decisions based on efficiency, just like the MPG rating for cars.

How do they work?

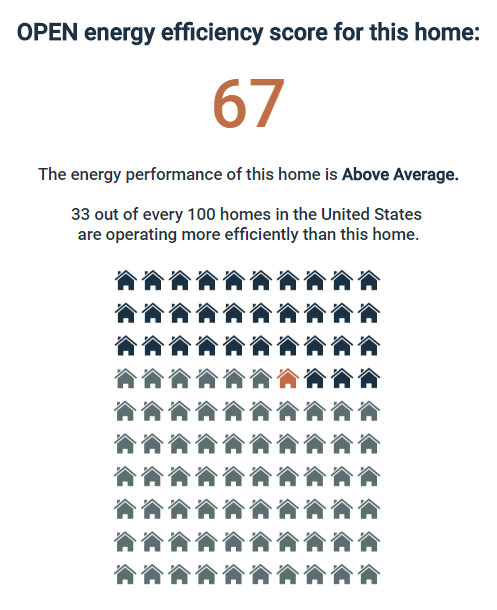
The two largest players in this space—Utility Score and Tendril1—use energy models and data based primarily on public records (e.g. tax assessment and real estate data) to estimate energy consumption and costs for a given home. These estimates are then used to generate a score between 1 and 100, where 100 represents homes with the lowest energy costs.

UtilityScore_RealEstate
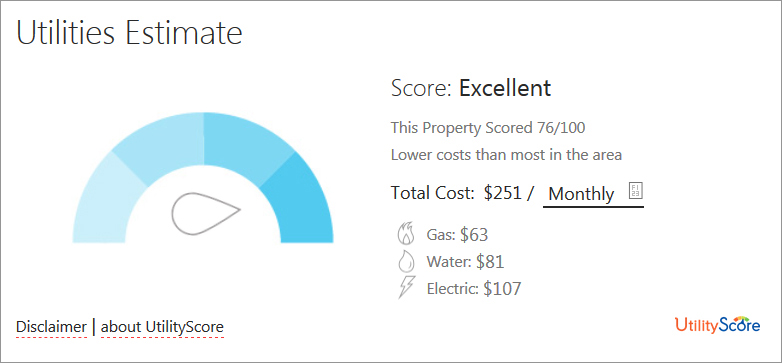
Utility Score on RealEstate.com (image credit: http://www.realestate.com)

Public record scores do not require an on-site visit and are calculated programmatically, which drastically reduces cost and increases scale. Utility Score alone has calculated scores for 84 million single-family homes—over 70% of all occupied homes in the U.S. This is far beyond the approximately 1.8 million homes scored with HERS and HES to date.

The RMI report states that “the availability of this data will have an immediate positive impact for consumers,” and cites a study that finds 81% of people who expect to buy a new home in the next 2 years believe that energy efficiency “would cause them to choose one home over another.” This research implies that sharing efficiency scores can have a real impact, but what happens if the scores shared aren’t accurate?

The problem

I’ve analyzed public record scores for thousands of homes, and found only the weakest of correlations between these scores and established asset assessments like HERS and HES. Although my analysis has not focused on Utility Score or Tendril, I’m certain they are only slightly more accurate than throwing darts for any given home. 2

How can I be so sure? Because the inputs to the energy models are lacking for most homes. The public record data used to generate these scores is not always reliable, and there simply isn’t enough detail in the data—even if it were clean—to generate a score with consistent “MPG” accuracy. Inadequate data necessitates assumptions in the models that may align with regional trends, but results in poor marksmanship for individual homes. For example, without good data we have to guess at the levels of insulation in a home based on its construction year, location, or other factors. We’re able to make an educated guess (Tendril calls these “smart defaults”) by looking at what similar homes in that region typically have, but we don’t usually know how much insulation a particular home has (or how well it was installed). Since insulation is a key driver of energy consumption, just this one data point can sink the accuracy of a score. We then repeat this process for HVAC efficiency, air leakiness, window types—you get the idea. Mix in some incorrect building size and age data, and it becomes clear that we’re not likely to see accurate scores for most homes.

It’s not the models used by these organizations that are the issue, it’s the lack of accurate information we have on specific homes. These scores can provide reasonable approximations of energy efficiency for homes that match their assumptions, and this may occur for a significant percentage of homes. The underlying research behind the model defaults combined with the glacial pace of efficiency improvements in the housing stock help assure this. If home size and year constructed in the public record data are accurate and most other model assumptions align with reality, a public record score can hit the bullseye. Unfortunately, this is not likely to happen consistently enough to maintain consumer trust—especially when some individual scores miss the dartboard entirely.

Does it matter?

Like RMI, I want to see energy data on real estate listings. The idea is that disclosing energy information will lead to demand for efficient homes, which will encourage investments in home efficiency in a virtuous cycle. The isn’t just theory; academic researchers in the Netherlands found that homes that disclosed good energy scores sold for a 3.6% premium over similar homes with poor scores. As RMI states in their report, “homebuyers can use this information to compare homes and as a data point for negotiation with sellers.” It’s unclear what the long-term impact of sharing inaccurate scores might be, but there are three possible outcomes for individual homes today:

  1. A home receives a better score than it merits. Here a home is rewarded for fictional efficiency. The seller wins, as the house looks good on paper (or pixels), while the buyer potentially pays a premium for efficiency that doesn’t exist.
  2. A home receives a worse score than it merits. In this scenario, a home is not recognized for its efficiency and may sell for a discount because of this. The homebuyer gets a deal, while the seller may lose out.
  3. Finally, in some cases—when we have accurate data and most model assumptions match reality—a public record score will accurately reflect the efficiency of the home. Everybody wins, but this happens rarely enough that it becomes noise instead of feedback that drives demand for efficient buildings.

Homebuyers might trust the scores for some time (regardless of any disclaimers about accuracy), but may eventually devalue or ignore the scores altogether. It could prove difficult to win back consumer trust in the future when reliable scores are widely available.

It’s possible that disclosure of inaccurate scores on real estate sites will motivate owners of efficient homes to pay for a comprehensive asset rating like HERS or HES, which can be used to set the record straight. The end result might seem positive (more homes with reputable ratings), but what will be the effect of forcing homeowners to pay to correct a metric that was made public without their consent?

Alternatives

The idea of widely expanding the availability of home efficiency information on real estate sites is a good one, but the data we share should be reasonably accurate for all homes. Here are some alternatives to the public record model that sacrifice scaling-speed for accuracy:

  • Make existing asset scores like HERS and HES visible in the real estate market. The Home Energy Labeling Information Exchange (HELIX) project aims to do just this by creating a central database that can store and provide certified asset ratings to local Multiple Listing Services (MLS) and real estate websites like Zillow and Trulia. This project will complement and streamline the work already being done by MLS across the country to expose home efficiency information.

HELIX-chart

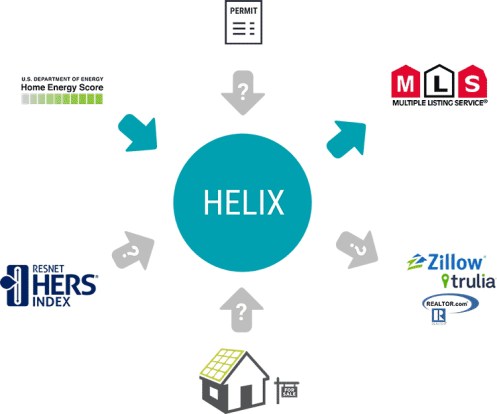
HELIX inputs/outputs (image credit: www.neep.org)

  • Increase the number of homes scored through local ordinances and legislation, like the bill proposed in Massachusetts that would require homeowners to disclose an approved asset score to potential buyers. The city of Portland Oregon has passed a similar ordinance, which requires disclosure of Home Energy Scores beginning January 1, 2018.
  • Make sure every home that gets an energy audit has a reputable asset rating calculated as part of the assessment. It’s a missed opportunity to go into a home and gather nearly all the data needed to generate a score without actually producing one. This is a provision in the Massachusetts bill mentioned above.
  • Share operational data (i.e. consumption and cost info from utility bills) and/or scores produced with this data instead of asset ratings. Disclosure of utility bill information to prospective homebuyers is already required in Alaska, Hawaii and Montgomery County Maryland, and has been done successfully in New York State and Chicago since 1987. This approach could scale rapidly if we had utility company cooperation, which admittedly is no small thing.

Although scores based on public record data are not accurate enough to provide a true MPG for homes, they do have value. For example, they can be used to estimate average residential energy consumption and costs for a particular region, identify homes that are likely to be good candidates for efficiency upgrades, or estimate the regional impact of weatherization efforts. These scores can be useful for planning and cost/benefit analysis, but not for influencing individual real estate transactions—at least not with the data we have available today.

RMI is right that we need to disclose energy information to homebuyers. Residential efficiency is not improving quickly enough, and we must leverage markets to create demand for efficient homes. It’s possible that public record scores will disrupt the market in a positive way, but there is real risk that we will do more harm than good by sharing scores that aren’t ready for mass consumption.


1 Update on December 11, 2017: Per RMI, Tendril has announced they are shutting down their public record energy scoring services.

2 I have compared HERS and Utility Scores for a small sample of efficient homes (i.e. where HERS index < 100). Although not a conclusive test, the results do support the dart analogy. Utility Scores are available for free at www.myutilityscore.com.


Increasing the Massachusetts RPS: It Makes Economic Sense

In 2016, a small group of energy wonks and climate activists attempted to reconcile Massachusetts legislative energy proposals with the state’s mandated Global Warming Solutions Act (GWSA) targets and the larger, national emission reductions needed to keep warming to 1.5°C or 2°C. This group quickly came to the conclusion that Massachusetts policy proposals were inadequate.

We knew the Renewable Portfolio Standard (RPS) proposals at the time—a 2% increase was considered aggressive—were lacking, but wanted to model the impacts of a large annual RPS increase (i.e. 3% or more) before advocating for it. We wanted to be able to answer the following questions:

  1. Is it feasible within the existing power market structure?
  2. How will it impact utility ratepayers?
  3. What effect will it have on jobs?

We now have our answers. Thanks to modeling performed by Synapse Energy & Sustainable Energy Advantage, we know that aggressively increasing the Massachusetts RPS is not only feasible, but will have a minimal impact on utility bills and a large positive impact on jobs. These organizations modeled the energy, climate and economic effects of various RPS and natural gas price scenarios, ranging from status quo (1% annual Massachusetts increase) to increasing the MA RPS by 3% each year along with a 1.5% increase to Connecticut’s RPS (roughly equivalent to increasing the MA RPS by 3.75% alone).

The analysis revealed that there are no economic barriers to increasing the RPS. Any barriers remaining are purely political.

Utility bill impacts
Modeling of different RPS scenarios revealed only modest electricity bill increases for residential customers. The most aggressive scenario modeled (3% MA RPS with 1.5% for CT) resulted in an average monthly bill increase of only $2.17 between 2018 and 2030. Although the modeling focused on residential costs, the authors of the study expect that industrial and commercial customers “would see similarly small bill impacts to those described for residential customers.”

How does a Massachusetts RPS increase affect prices specifically?

As the RPS increases, we see a lowering of wholesale market prices. Renewable energy systems displace higher-cost generators when renewable systems are able to produce electricity. This leads to greater utilization of low-cost resources and lower average wholesale prices.

Modeling revealed no significant impact on capacity prices (the price paid to generators to maintain future dispatchable electricity capacity) through 2030 even with an annual MA RPS increase of 3%.

The modest utility bill increases we see in the 3% MA RPS scenario come from the cost of purchasing RECs (which will increase in price with increased demand) along with additional transmission and distribution costs associated with higher levels of renewable generation. These costs are partially offset by the reduction in wholesale prices, but the net result is a small increase in average monthly electricity bills.

Protection from rising natural gas prices
Increasing the RPS can protect Massachusetts residents from future volatility in natural gas prices. Massachusetts has become overreliant on natural gas, which is the primary driver of the price we pay for electricity. According to the Energy Information Administration (EIA), 66% of our electricity was generated by natural gas in 2016. Modeling shows that if gas prices rise significantly as some expect, increasing the RPS substantially could save New England consumers up to $2.1 billion in wholesale costs between 2018 and 2030.

Per the EIA, natural gas prices are likely to rise due to production expansion into more expensive areas combined with increases in liquefied natural gas (LNG) and petrochemical exports. These exports will decrease the domestic supply of natural gas, forcing prices upward. Trump administration actions may also increase demand. These include withdrawal from the Paris Climate Accord, promoting pipeline expansion efforts that increase exports, and removing regulatory barriers to LNG exports.

Natural gas prices will almost certainly rise in the future, but an aggressive shift to renewable energy can minimize the effect on electricity prices.

Impact on jobs
Modeling of a 3% MA RPS reveals a net positive impact on jobs, with higher RPS increases resulting in more jobs in the region. In the years between 2018 and 2030, we find a net increase (accounting for job losses in the fossil fuel industry) of 18,000 jobs from a 2% MA RPS increase combined with a 1.5% increase in CT, and 33,400 jobs with a 3% MA increase combined with a 1.5% CT increase. A more aggressive RPS means more jobs.

RPS_jobs
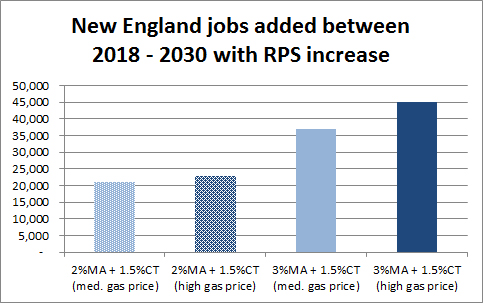
Net job gains from various RPS increase and natural gas price scenarios

We also find from the analysis that maintaining the current 1% annual MA RPS increase or even moving to a 2% increase without a change to the Connecticut RPS will not boost jobs. The required procurement of 1,600 megawatts of offshore wind in the 2016 Energy Diversity Act will shift the market, resulting in the supply of renewable energy (as measured in RECs) outpacing demand. The RPS is meant to drive renewable energy development, but the Massachusetts RPS will simply perform backfill duties unless it’s strengthened.

Summary
Massachusetts has done an admirable job of promoting renewable energy growth, yet we are still behind in meeting our climate climate goals. Wind procurement mandates in the Energy Diversity Act will help, but a significant RPS increase is needed to further promote renewable energy growth in the state and region. All of our electricity must be generated from carbon-free sources in the not-too-distant future if we have any hope of limiting warming to 1.5C or 2C.

Fortunately, we have evidence that significantly increasing the RPS will provide two critical economic benefits with minimal cost to ratepayers:

Risk reduction/price stabilization: a large RPS can protect electricity ratepayers from rising natural gas prices and help stabilize volatile electricity rates associated with our dependence on natural gas. The wind and sun are free, while natural gas prices fluctuate with supply, demand, politics and policy.

Jobs: increasing the RPS will result in a net increase in regional jobs, with more jobs associated with greater rates of RPS growth.

Massachusetts can hedge against the risk of rising natural gas prices, reduce emissions and create jobs by aggressively increasing the RPS—all with little cost to ratepayers. This is a policy decision that’s good for business, good for citizens and good for the state.

OPEN Scores on the Rise

A quick update on my March blog post about benchmarking the performance of our recently insulated apartment. We moved out at the end of June, but not before calculating one last OPEN score. Here’s the updated graph of our monthly scores and energy consumption:

Apartment_OPEN_score_revised

As you can see, the cellulose insulation installed at the end of January led to improved OPEN scores through the spring, leveling out around 70—a nice jump from the 63 we averaged prior to the insulation work. Had we stayed in the apartment, our scores would have resumed their upward trajectory once we returned to heating season in the fall. Although we won’t be able to quantify the full impact of the cellulose due to the move, we know it was significant; our home is already operating more efficiently than 70% of homes in the U.S. I suspect our OPEN score would have plateaued around 75 if we had completed a full year in the apartment post-cellulose.

We used just 2,570 kWh and 629 therms of natural gas (used for heat and hot water) over the last 12 months of our occupancy, for a total cost of $1,424. The owner of the apartment is now using its efficiency as marketing for prospective tenants. The next occupants will save money and we (collectively) will avoid ~1 metric ton of CO2e emissions (roughly equivalent to driving a car 2,400 miles) each year for the life of the home.

Not bad for a few hundred dollars and a bit of coordination work.

New Research on the Effects of Sharing Home Energy Reports

Home Energy Report (HER) programs could be more effective with targeted participation, and it’s difficult to predict how people will respond to feedback. This is what I took away from research presented by Opinion Dynamics on a recent Better Buildings Residential Network Peer Exchange call. The research dissected the ~2% net energy reduction found when Home Energy Reports (HERs) are shared with utility customers. HERs are those smiley faces, graphs and neighbor comparisons we commonly see our utility bills. The ~2% reduction is a reference to research from MIT and others that have found an aggregate reduction in energy consumption of about 2% just by sharing HERs with a population of utility customers.

HER_example
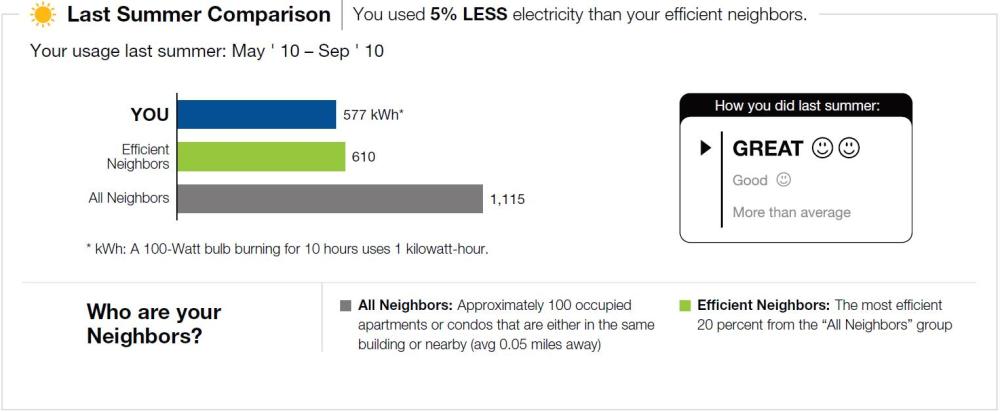
Home energy report example (image credit: http://www.cityofpasadena.net)

Opinion Dynamics evaluated a long-term HER program with over 250,000 customers, who were grouped into five different categories depending on how much energy they saved after receiving HERs. The analysis revealed that while the net effect of the HER program was positive (i.e. energy was saved), 40% of the customers evaluated actually used more electricity—consistently—after receiving the HERs. If not for the increased consumption from this subset of customers, overall energy savings from the program would have been significantly higher. These findings may seem counter-intuitive, but they support behavioral research we’ve done here at Resynergy Systems.

OD_savings_distribution
Distribution of customers by HER energy savings (image credit: Opinion Dynamics)

We conducted a randomized control trial that evaluated the effect of sharing above-average OPEN scores with homeowners during home energy audits. We wanted to know if homeowners would be more likely to invest in energy efficiency when receiving a score. We found that in the aggregate, homeowners who received a score were more likely to say they would invest in energy efficiency. However, we also found a small subset of homeowners who were less likely to say they would invest—even though everyone received the same above-average score of 64. Like HER programs, the net result of our experiment was positive, but sharing the score did not affect everyone the same way. In our research, the people less likely to say they would invest were those that indicated they did not pay close attention to their utility bills.

I don’t know if Opinion Dynamics identified common characteristics for the negative savers in their research—they recommended stopping the HER intervention once a negative impact is found for a particular customer. Ideally, we would identify people that are likely to respond negatively before intervening in the first place. Why wait until they exhibit the behavior we are trying to avoid?

Humans are funny creatures and our behavior is (sometimes) difficult to predict, but better understanding the science behind decision making is key to reducing energy consumption in the future. The research conducted by Opinion Dynamics is important and illuminating.

OPENing Our Home

Our apartment in Cambridge Massachusetts is similar to many in the region—just under 1,000 ft2 of space in a three family home built in the early 20th century. It’s a wonderful building with charm and character, but literally no insulation. It’s been a cold and generally uncomfortable space during much of the winter. Fortunately for us, that changed this past January when we had cellulose insulation blown into the exterior walls through the Mass Save program. We had over $3,300 worth of insulation work done and paid just a fraction of the cost; if your state offers free or discounted energy audits and efficiency work, you should seriously consider it.

I’ve been tracking our energy consumption since we moved in just under 2 years ago, and calculating OPEN (operational energy) efficiency scores each month since our first year. Our average score has been a 63 (out of 100), which is above average but not great considering the steps we have taken to reduce our electricity use—killing vampire loads, using LED bulbs, shutting down our wireless router when not in use, etc. These steps certainly improved our score (and saved us money), but it’s just not possible to have an efficient home—even an apartment—in the northeast without insulation. Energy required for space heating dominates here; it accounts for approximately 68% of the energy used in our apartment, with 22% used for hot water and 12% for electricity (nationally these averages are 41.5%, 17.7% and 40.8% respectively).

apartment_energy_allocation
My wife and I agree that the apartment feels more comfortable since the insulation was blown in, but I’ve been looking forward to seeing the impact the insulation work would have on our OPEN score. I want to be able to quantify the improvement rather than relying solely on our (likely biased) qualitative assessment. After receiving our first utility bills since the work was done and calculating a score, this is what we found:

OPEN_scores_Jan_2017_v2

After just a single winter month, our OPEN score jumped from an average of 63 to a 67! As you can see from the graph, our score over the last year (dark blue line) has been fairly consistent, bouncing between a low of 61 and a high of 64 prior to the insulation. It will be interesting to see how the score progresses over the next few months, but it’s already clear that there is a quantifiable improvement in our home’s energy performance. It’s gratifying to see that the money and time spent on the insulation work is having a definitive impact.

Calculate OPEN scores for your home here: www.resynergysystems.com

Author’s note: The OPEN score and energy consumption graph in this post was updated on March 29th 2017 to correct for a data entry error. Text referring to incorrect scores has been updated as well.

Messages to the Future

trisha
Trisha Shrum at COP 21 in Paris

“You are not yet a year old. And I love you dearly. And I wanted to write you a letter to open in 50 years.” So begins a heartfelt letter from Trisha Shrum to her daughter Eleanor. The letter is more than a proclamation of love; it is an attempt to take climate change—an apathy inducing problem of unimaginable scale—and make it real, and personal, by relating it to her child.

As an academic studying environmental science and behavioral economics at Yale, Harvard and now the University of Colorado, Trisha has been investigating climate change issues and policy for over 10 years. Her academic background and the perspective that comes from being a new parent provided the tinder for an idea sparked by the words of Christiana Figueres, the Executive Secretary of the United Nations Framework Convention on Climate Change. Trisha writes of Figueres, “She said that future generations will look back on us and be shocked that we knew what climate change would likely entail and we didn’t do anything to stop it.”

The idea that emerged was to have people send messages to their descendants about the actions they were taking (or not) to address climate change. Trisha wrote to Eleanor, “If every person alive today wrote a letter to their children or grandchildren about their position and action on climate change, then we just might get somewhere. So I’m going to start with me and you.”

Trisha wrote that first letter and worked with co-founder Jill Kubit to build DearTomorrow, a project dedicated to making climate change personal by motivating people to write letters and create photo and video messages to loved ones in the future. They now have hundreds of letters and photos on their website. These are messages of love, concern and hope; messages meant to encourage action and help their authors and creators see climate change from a new perspective.

Trisha finished that first letter to her daughter with these words: “For you and for everyone else, I will try harder.”

And she has.

Explore existing letters and create your own message to the future by visiting www.deartomorrow.org.

Is Above Average Good Enough For You?

Did you ever receive a grade of “B” in a high school math class? How would have felt if you had? Would you have changed your behavior, maybe studying more (or less)? The answer is likely different for each of us; some might have felt happiness or relief, others disappointment and a determination to work harder. The grade would have affected each of us differently.

Might this be true for home energy scores as well?

Here at Resynergy Systems, we’re not only interested in sharing OPEN operational efficiency ratings with homeowners to help them understand how their homes are performing, we’re also interested in understanding the effect of sharing a rating with a homeowner—does the score itself impact behavior?

We had a theory—based on research from MIT—that sharing an operational rating during a home energy assessment would influence a homeowner’s decision to invest in efficiency upgrades. In order to test this theory, we decided to conduct an online experiment based on self-reported intention.

There were some surprises in our findings, but the results strongly supported our hypothesis that homeowners who received an operational rating would be more likely to invest in energy efficiency.

What did we do?
Our main hypothesis was that homeowners who receive a less than stellar operational score for their home would be more likely to invest in efficiency upgrades (e.g. air sealing or insulation work) than those who do not receive a score. We also thought this effect might be stronger for homeowners who were concerned about their energy consumption for environmental or cost reasons. We wanted to conduct a randomized control trial to confirm or reject our theory.

We discussed our ideas with Trisha Shrum, an environmental economist from Harvard (and co-founder of DearTomorrow) who provided feedback and guidance on structuring the research. She also pointed us to Amazon’s Mechanical Turk, an online marketplace used by academics and businesses for research and virtual work services. “MTurk” is a global network of web-connected workers, who review and can decide to accept Human Intelligence Tasks (HITs)—virtual work requests—for pay. In our case, we paid Turk workers a small amount of money to participate in a survey we constructed for this research.

The survey walked each participant through a hypothetical home energy assessment (i.e. audit), with a real-time randomization process that allowed a subset of participants to receive an OPEN score for their home as part of the assessment. We settled on sharing a conservative, above average score of 64 (out of 100, where 100 indicates most efficient) for the study, which we presented visually:

OPEN_score_homes_sample_v1
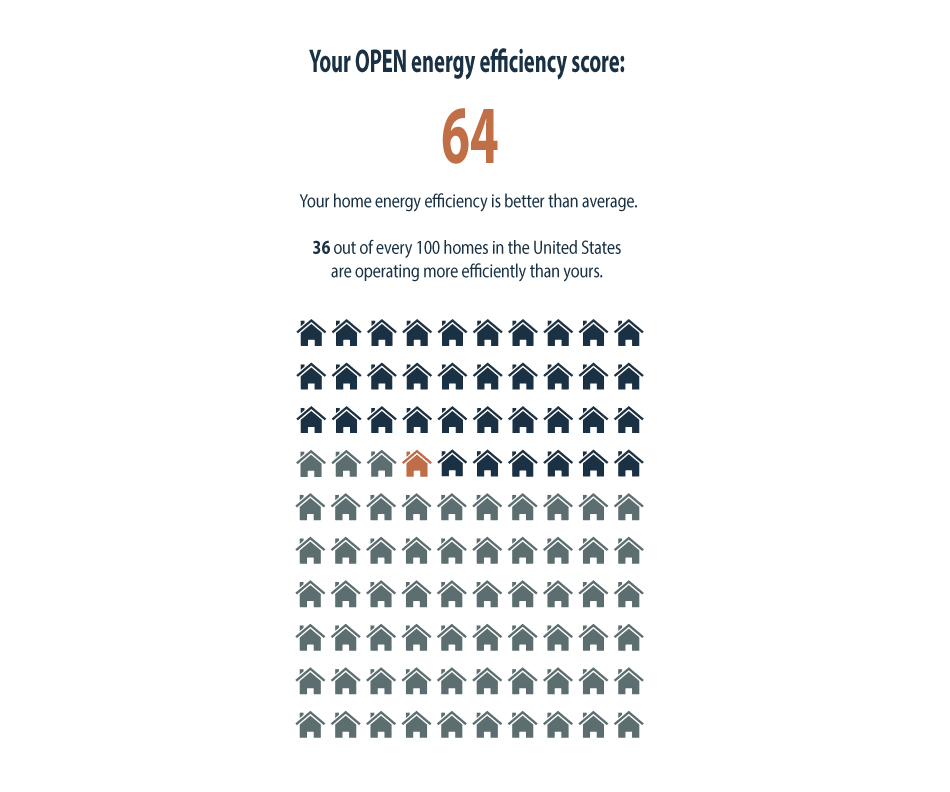
OPEN rating comparison graphic

Only U.S. residents were allowed to participate, and our goal was 400 responses. We had 401 responses in total, with 16 that were incomplete or failed to meet our data quality standards. This left us with unique and clean responses from 385 participants in 47 different states (if you are curious, we missed Idaho, Nebraska and South Dakota). Just under half (48%) of our participants received the OPEN score during their virtual assessment (all receiving the same score of 64, as shown above). These respondents were also asked a series of questions to help us understand how they felt about the score. The remaining participants (52%) did not receive a score and were not aware that the other participants had received one. All respondents were asked the same set of questions about their willingness to invest in efficiency after the audit, and all were presented with the same efficiency upgrade options with deeply subsidized costs: leave the home as is ($0), air seal the home ($100) or insulate and air seal the home ($500). We then asked a series of questions about energy use attention and concern, along with a handful of demographic questions.

research_flow
OPEN rating research structure

What did we find?
We first looked at the entire population of respondents. As expected, we found that homeowners receiving an OPEN score were more likely to say they would invest in air sealing or insulation work, with a moderate increase of 4.2%. Although we could not confirm our hypothesis as this result was not statistically significant (p=0.433), it was promising.

We then analyzed three subgroups within the overall population based on their responses to our survey questions. These groups represent respondents who indicated they:

  • Pay close attention to utility bills (the “attention” group)
  • Are very concerned about reducing energy use (the “concern” group)
  • Feel utility bills are expensive (the “expensive” group)

We believe these subgroups represent homeowners that are concerned about their energy consumption for economic or environmental reasons. When we investigated the effect of a score on these groups, we found that participants in each were over 9% more likely to say they would invest in efficiency when they received an OPEN score. However, the results were only statistically significant (α level .05) in one group: those that identified as paying close attention to utility bills.

A little analysis revealed that the “attention” group encompasses most of the other two subgroups. Of the 250 respondents falling into the “attention” group, 83% also identified as being very concerned about reducing energy use at home, felt their utility bills were expensive, or both. (This is slightly higher than the 75% of respondents in the “expensive” group that belong to either or both of the other two groups.) We believe it is these homeowner concerns that are driving the attention paid to utility bills.

Turk_Respondents_v5_whole_groups 
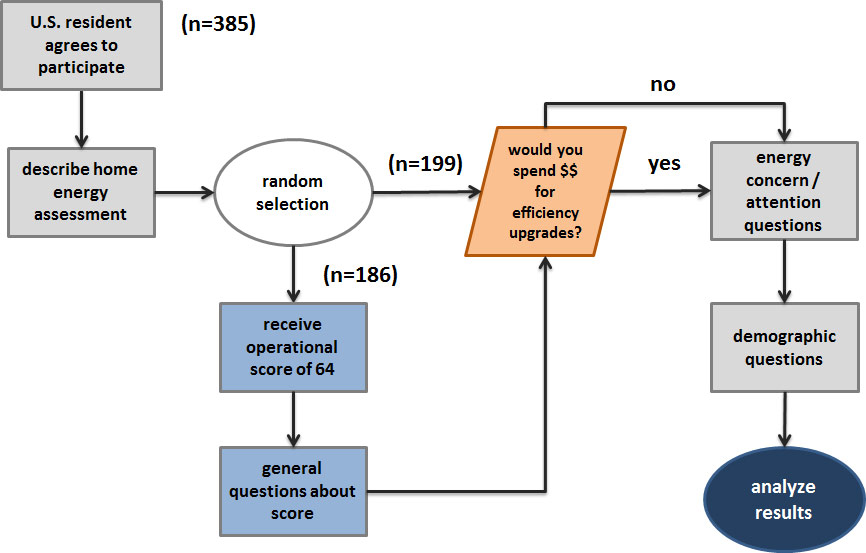
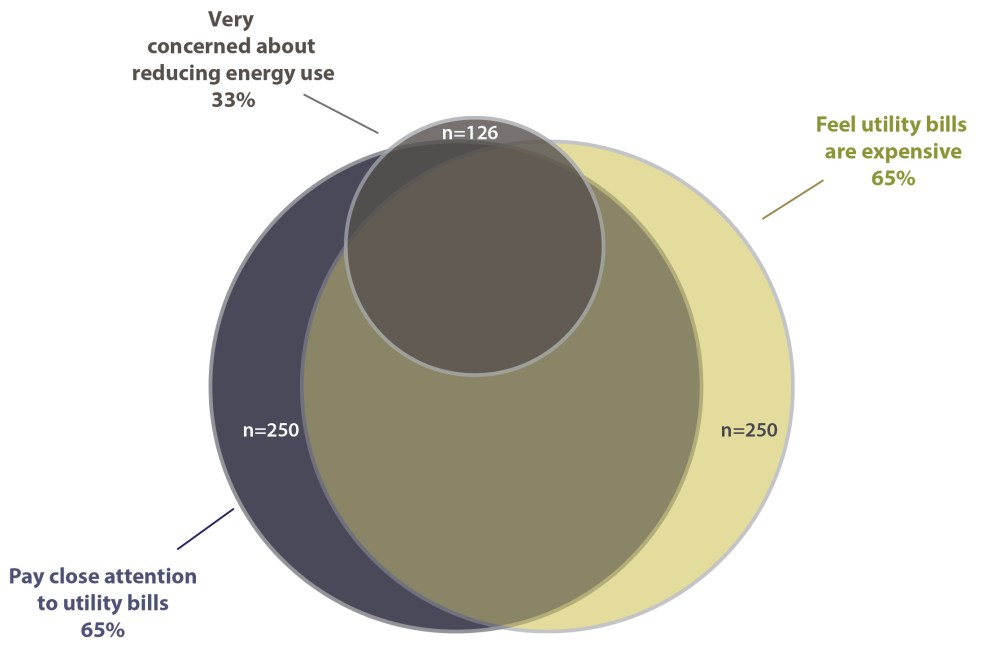
Breakdown of respondents concerned about their energy use

The effect of an OPEN score on the “attention” group was statistically significant and compelling. This group represents 65% of our total sample population, and these homeowners were 11.8% more likely to say they would invest in efficiency upgrades when receiving a score (p=0.046).

group % more likely to invest when OPEN score received
 p-value   size (n)
% in Attention group
Attention 11.8% 0.046 250 100.0%
Expensive 11.0% 0.085 250 72.4%
Concern 9.4% 0.169 126 91.2%

These results provide preliminary evidence that receiving an OPEN score may motivate homeowners to invest in efficiency—especially if they pay close attention to their utility bills (i.e. are concerned about energy consumption) to begin with.

The survey provided other important insights:

  • 72% of respondents wanted to know how their energy use compared to other homes. This suggests that people are both interested, and do not currently know, how their energy use compares to others.
  • 82% of respondents indicated they were completely comfortable (57%) or somewhat comfortable (25%) sharing utility information with an energy auditor. This contradicts the belief that homeowners are concerned about privacy and reluctant to share energy data.
  • 90% of respondents who received a score indicated they would take action to improve their OPEN rating if they received a score of 25 or less. Lower scores likely provide a stronger incentive for homeowners to reduce consumption and invest in energy efficiency.

Does it matter?
These findings demonstrate that simply sharing an efficiency score with a homeowner may encourage investment in energy efficiency. Although our experiment was based on an operational score, it is not unreasonable to think we would see similar results from an asset score if shared in a context meaningful to homeowners. One benefit of an operational score, however, is that it is a reflection of a homeowner’s actual energy use and not simply the result of energy modelling of the physical structure.

These results may be especially significant for residential efficiency programs, as the people most affected by the OPEN score indicated they pay close attention to their bills; these are likely the homeowners requesting energy audits and taking advantage of efficiency program offerings. Efficiency programs should consider targeting this population, as sharing an operational score with this group may have substantial benefits with relatively little cost.

Our findings also point to the idea that an OPEN score does not have the same meaning for all people. Although this needs further study (and data), our research suggests that receiving an OPEN score may not have the same effect on homeowners who are unconcerned about energy consumption. In fact, people who indicated they do not pay close attention to their utility bills and received the OPEN score of 64 were 10.9% less likely to say they would invest in efficiency in this study. These results were not statistically significant (p=0.3), but in the same way that a “B” grade has different significance for individual students, it is possible that less-concerned homeowners view a score of 64 as a positive rather than negative. Again, this needs further study, but these results are interesting and unexpected.

Summary
Our initial research results are promising, and we plan to continue our study by providing a randomized set of homeowners their actual OPEN ratings, based on their own energy use, during home energy assessments. We expect to find that homeowners receiving an unsatisfactory energy rating will be more likely to spend real money on efficiency improvements to their home, and that the determination of unsatisfactory is subjective. The actual score received will strongly influence the likelihood of taking action, but the magnitude of the effect will depend on the mindset of the person receiving it.

The idea that sharing an operational efficiency rating may influence homeowner behavior has implications beyond home energy assessments. Other related research questions we want to answer:

  • Will sharing OPEN ratings as part of outreach efforts motivate homeowners to request home energy assessments?
  • What is the effect of sharing an OPEN rating with a homebuyer or renter as part of a real estate transaction?

More to come.


Author’s note: If you have questions, ideas for further research or would like to collaborate with us on research in the field, please contact us.

In Defense of a Home Energy Label

The Boston Herald recently published my Letter to the Editor, written in response to their editorial disparaging Massachusetts legislation that would require a home energy audit and disclosure of an energy label (i.e. rating) prior to a sale. I disagree with the editorial, but the Herald earned my respect for their willingness to publish an opposing view. They edited my letter slightly, and since I prefer the original (I’m completely unbiased of course), here it is:

The Herald editorial on July 3rd was a disappointment. It misleadingly criticizes Senate legislation that would require homeowners to disclose energy assessment results to prospective homebuyers. The claim made by the Herald that buyers will “simply filter out” low-performing properties has no basis in fact, and contradicts the claim made in the same editorial that homebuyers already “have an idea” if a home is efficient before buying.

Disclosing an energy label—an intuitive score based on the physical characteristics of a home—provides important information to homebuyers and leverages the market to improve efficiency. Few of us would buy a car without knowing its MPG rating, yet we spend far more money on our homes without knowing how much energy they will use. Much like Energy Star ratings for appliances, home energy labels help consumers make better informed decisions, which leads to more efficient homes. And research by the University of North Carolina and the Institute for Market Transformation (IMT) found that owners of energy efficient homes are 30% less likely to default on their mortgages.

We must reduce residential energy consumption if we have any hope of meeting our legally binding Global Warming Solutions Act (GWSA) targets. Requiring energy audits and home energy labels is a step in the right direction. Hyperbolic editorials and labeling citizens as “climate zealots” helps not at all.

Paris and the GWSA: Resetting our Targets

The Paris Agreement
The recent Paris Agreement represents tremendous progress in the fight against climate change; countries around the world have agreed to take real action to limit warming to no more than 2°C (3.6°F) while making efforts to keep warming below 1.5°C (2.7°F). The 1.5°C goal is important; the mantra “1.5 to stay alive” started with small island nations that understand 2°C means disaster for low-lying countries. 2°C may also spell disaster for coastal cities like Miami and New Orleans, where rising seas associated with 2°C warming would inundate these cities by 2100. In short, the 2°C goal is inadequate to protect vulnerable communities from climate change—or as Naomi Klein writes, “It’s a target that is beyond reckless.”

The Paris Agreement is progress, but analysis of the non-binding nationally determined contributions (NDCs) made by each country as part of the Agreement shows they are insufficient; the NDCs on their own would leave us with warming of 3.5°C (6.3°F) by 2100. COP21 brought the world together to take action, but it’s not yet enough.

Climate Interactive—a non-profit run by Systems Dynamics experts associated with MIT—has modeled various global greenhouse gas (GHG) emission scenarios and outlined 2030 emission reduction requirements for both the 1.5°C and 2°C thresholds. 2030 is a critical date from a climate perspective; if we don’t cut emissions sufficiently by this point, taking the action necessary to curb emissions will become prohibitively difficult. Analysis from Climate Interactive shows the U.S. must reduce emissions by 60% from 2005 levels by 2030 to keep warming to 1.5°C, with a 45% reduction required if we’re willing to take our chances with 2°C. Current U.S. pledges aim for emission reductions of 26% by 2025, far from either target.

Massachusetts Goals Lacking
What does this mean for Massachusetts? If we look to our current (and legally binding) Global Warming Solutions Act (GWSA) emission reduction targets, we find they are not sufficient to meet either the 1.5°C or even the 2°C national targets. Although no firm 2030 GWSA target has yet been set, a recent bill passed by the state senate aims to set a “firm” 2030 reduction goal of 35-45% from 1990 levels. The high end of this range would keep Massachusetts in-line with the 2°C Climate Interactive targets—if the state attempts to reach it. The Climate Interactive reduction targets for 2°C and 1.5°C normalized to the GWSA 1990 baseline are 44.13% and 59.37% respectively.1

GWSA_2030_goals
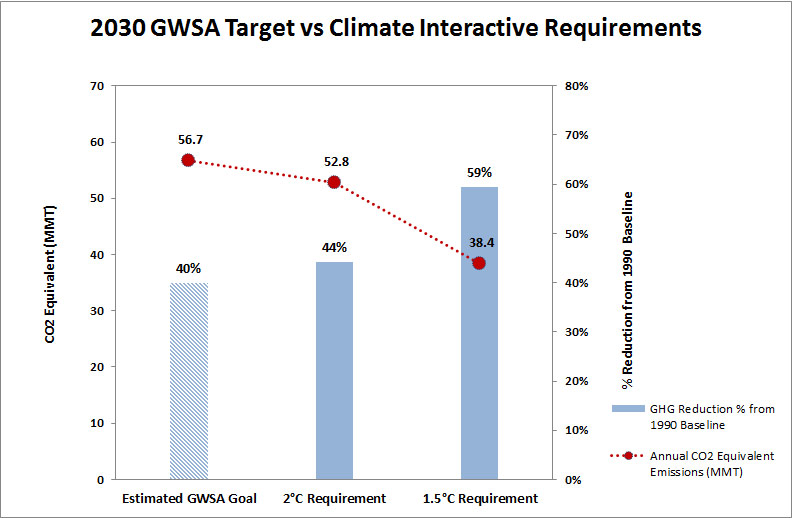
Comparison of a potential Massachusetts GWSA 2030 target with Climate Interactive requirements

The good news is that the outer range of the 2030 proposal for the GWSA is nearly sufficient to meet the 2°C target. The bad news is that Massachusetts is efficient, environmentally progressive and has tremendous offshore wind potential that has yet to be tapped. If a state like Massachusetts can’t hit the 1.5°C reduction target for 2030 or even the 2°C target with certainty, how can we expect other states to do it?

A New Goal for 2030
Massachusetts should take the bold and necessary step of setting a goal for 2030 commensurate with the need: a 60% reduction of greenhouse gas emissions (using the GWSA 1990 baseline) by 2030. Anything less and we resign ourselves to 2°C warming—at best. Insufficient Massachusetts goals alone won’t push the U.S. over national emission limits, but this is an issue of commons. If every state limits its actions and goals to those that appear politically feasible, we have little hope of keeping warming below even 2°C without federal regulation. And hoping for federal intervention is not an ideal contingency plan given the partisanship and proliferation of science doubters and deniers in Congress. States like Massachusetts must lead.

A strong 2030 emission goal for Massachusetts is an opportunity—a chance to boost the economy, create jobs and improve resiliency by generating electricity with regional renewable resources and improving the efficiency of our building and transportation sectors. A study by Synapse Energy Economics modelled policies required to reach a 40% reduction of emissions by 2030 for states that participate in the Regional Greenhouse Gas Initiative (RGGI). These policies resulted in lower energy costs and thousands of new jobs for participating states. A 60% reduction will almost certainly yield greater economic benefits, but this scenario needs to be modelled in order to demonstrate feasibility and a path to implementation. We must show that not only is a 60% reduction goal necessary, it’s possible and beneficial.

________________________________________

1 Note: the 1990 and 2005 emissions baselines for Massachusetts are relatively close (94.5 and 96 MMT). Please see the 2015 update of the Clean Energy and Climate Plan for more details: http://www.mass.gov/eea/docs/eea/energy/cecp-for-2020.pdf

Strange Days

These are strange days in Massachusetts. A state known for its environmental leadership, we now argue over solar caps and net-metering rates while solar projects are shuttered or put on hold. We debate the merits of forcing electricity ratepayers (you and me) to pay $8 billion to construct natural gas pipelines, while new research from Harvard suggests the U.S. is responsible for a huge spike in global Methane emissions—with fracking the likely culprit. We consider the environmental and economic impacts of importing hydro electricity from Canada, while our own offshore wind resources —labeled the “Saudi Arabia of wind”—remain unutilized.

It appears some state policy proposals are based on economics that ignore or don’t properly weigh social or environmental costs, benefits and limits. There’s a continued focus on near-term concerns, while the long-term consequences of policy action (or inaction) are overlooked or discounted. We need to move beyond the short-term, beyond narrowly focused financial considerations.

There is hope. Many political leaders in the state want energy legislation that will benefit the commonwealth and fight climate change. We see this in the letter signed by 100 State Representatives advocating for a balanced, sensible approach to solar legislation: fair net-metering compensation, subsidy reform via the SREC program and grandfathering of existing systems.

This is good news. Let’s hope more Massachusetts political leaders act on their own beliefs, and not those of the utilities and fossil fuel industry.

Author’s note: This post is based on a letter I wrote for the Massachusetts Sierra Club as chair of the Greater Boston Group.