OPEN Scores on the Rise
A quick update on my March blog post about benchmarking the performance of our recently insulated apartment. We moved out at the end of June, but not before calculating one last OPEN score. Here’s the updated graph of our monthly scores and energy consumption:

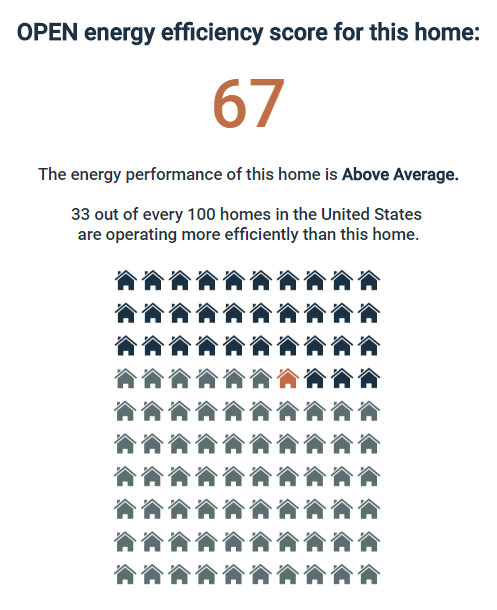
As you can see, the cellulose insulation installed at the end of January led to improved OPEN scores through the spring, leveling out around 70—a nice jump from the 63 we averaged prior to the insulation work. Had we stayed in the apartment, our scores would have resumed their upward trajectory once we returned to heating season in the fall. Although we won’t be able to quantify the full impact of the cellulose due to the move, we know it was significant; our home is already operating more efficiently than 70% of homes in the U.S. I suspect our OPEN score would have plateaued around 75 if we had completed a full year in the apartment post-cellulose.
We used just 2,570 kWh and 629 therms of natural gas (used for heat and hot water) over the last 12 months of our occupancy, for a total cost of $1,424. The owner of the apartment is now using its efficiency as marketing for prospective tenants. The next occupants will save money and we (collectively) will avoid ~1 metric ton of CO2e emissions (roughly equivalent to driving a car 2,400 miles) each year for the life of the home.
Not bad for a few hundred dollars and a bit of coordination work.